RESEARCH
RESEARCH
RESEARCH
Knowledge Resource and Data Management for Arizona Nonprofits Scope of Sector
Knowledge Resource and Data Management for Arizona Nonprofits Scope of Sector
Knowledge Resource and Data Management for Arizona Nonprofits Scope of Sector
Keywords
Keywords
Nonprofit, CRISM-DM Cycle, Data Governance, Data Visualization, Economic Impact, Measurement, Data Analysis, Tableau Dashboards, Social Impact, Knowledge Resource, Research, SQL, Community Service Managers
Nonprofit, CRISM-DM Cycle, Data Governance, Data Visualization, Economic Impact, Measurement, Data Analysis, Tableau Dashboards, Social Impact, Knowledge Resource, Research, SQL, Community Service Managers
Nonprofit, CRISM-DM Cycle, Data Governance, Data Visualization, Economic Impact, Measurement, Data Analysis, Tableau Dashboards, Social Impact, Knowledge Resource, Research, SQL, Community Service Managers
Arizona’s nonprofit sector lacked a centralized platform for assessing the sector’s scope, operational efficiency, and social impact. I led the Arizona Nonprofits Scope of Sector project at Arizona State University’s Lodestar Center for 8 months, where I developed comprehensive Tableau dashboards from scratch using the Cross-Industry Standard Process for Data Mining cycle.
The platform increased data transparency by 50%, improved resource allocation by 20%, and provided nonprofits with the tools to better serve underrepresented communities. The project provided key insights into how the nonprofit sector drives the Arizona economy and how these organizations, often serving underrepresented communities, contribute to social good.
Organization
Arizona State University

Industry
Education & Nonprofit Research Public Sector
My Role
Research Analyst Data Developer
Time
2018
Organization
Arizona State University
Industry
Education & Nonprofit Research Public Sector
My Role
Research Analyst Data Developer
Time
2018
My Responsibilities & Accomplishments
My Responsibilities & Accomplishments
My Responsibilities & Accomplishments
Full CRISM-DM Cycle Implementation: I applied the CRISM-DM cycle—from business understanding to deployment—when developing Tableau dashboards for visualizing nonprofit sector data. This involved data preparation, modeling, evaluation, and the delivery of interactive tools for public use.
Full CRISM-DM Cycle Implementation: I applied the CRISM-DM cycle—from business understanding to deployment—when developing Tableau dashboards for visualizing nonprofit sector data. This involved data preparation, modeling, evaluation, and the delivery of interactive tools for public use.
Full CRISM-DM Cycle Implementation: I applied the CRISM-DM cycle—from business understanding to deployment—when developing Tableau dashboards for visualizing nonprofit sector data. This involved data preparation, modeling, evaluation, and the delivery of interactive tools for public use.
Data Governance: Designed and managed a robust data governance framework to ensure data accuracy, security, and transparency. This included managing data sources from Arizona’s 28,000+ nonprofit organizations, ensuring data integrity across public charities, private foundations, and other nonprofit types.
Data Governance: Designed and managed a robust data governance framework to ensure data accuracy, security, and transparency. This included managing data sources from Arizona’s 28,000+ nonprofit organizations, ensuring data integrity across public charities, private foundations, and other nonprofit types.
Data Governance: Designed and managed a robust data governance framework to ensure data accuracy, security, and transparency. This included managing data sources from Arizona’s 28,000+ nonprofit organizations, ensuring data integrity across public charities, private foundations, and other nonprofit types.
Tableau Dashboard Development: Developed interactive, user-friendly data visualizations and dashboards using Tableau and SQL that enabled stakeholders to explore nonprofit employment, wages, economic contribution, and sector growth. These visualizations provided clear insights into nonprofit funding gaps, resource allocation, and the sector's overall economic contribution for non-technical users, such as nonprofit executives and community leaders.
Tableau Dashboard Development: Developed interactive, user-friendly data visualizations and dashboards using Tableau and SQL that enabled stakeholders to explore nonprofit employment, wages, economic contribution, and sector growth. These visualizations provided clear insights into nonprofit funding gaps, resource allocation, and the sector's overall economic contribution for non-technical users, such as nonprofit executives and community leaders.
Tableau Dashboard Development: Developed interactive, user-friendly data visualizations and dashboards using Tableau and SQL that enabled stakeholders to explore nonprofit employment, wages, economic contribution, and sector growth. These visualizations provided clear insights into nonprofit funding gaps, resource allocation, and the sector's overall economic contribution for non-technical users, such as nonprofit executives and community leaders.
Economic and Social Impact Research: Conducted quantitative and qualitative analyses of nonprofit data to evaluate the sector’s economic contribution and workforce trends. Analyzed key metrics such as revenue breakdowns by subsector, employment rates, wage comparisons, and geographic distributions of nonprofit impact.
Economic and Social Impact Research: Conducted quantitative and qualitative analyses of nonprofit data to evaluate the sector’s economic contribution and workforce trends. Analyzed key metrics such as revenue breakdowns by subsector, employment rates, wage comparisons, and geographic distributions of nonprofit impact.
Economic and Social Impact Research: Conducted quantitative and qualitative analyses of nonprofit data to evaluate the sector’s economic contribution and workforce trends. Analyzed key metrics such as revenue breakdowns by subsector, employment rates, wage comparisons, and geographic distributions of nonprofit impact.
Industry
Education & Nonprofit Research Public Sector
My Role
Research Analyst Data Developer
Time
2018
Organization
Arizona State University
Challanges
Challanges
Challanges
Data Complexity and Diversity: The Arizona nonprofit sector, with over 28,000 registered organizations, lacked a centralized platform. Integrating data from more than 28,000 nonprofit organizations posed a significant challenge due to the diversity in reporting standards and the variance in data availability across different nonprofit subsectors.
Stakeholder Engagement: Ensuring buy-in from nonprofit leaders, funders, and policymakers required presenting complex data in an accessible and actionable format, especially for non-technical users who needed to leverage the platform for decision-making.
Limited Resources for Data Collection: Many smaller nonprofits lacked the infrastructure to provide comprehensive data, leading to gaps that required additional qualitative research and proxy data methods to ensure completeness.
Solutions
Solutions
Solutions
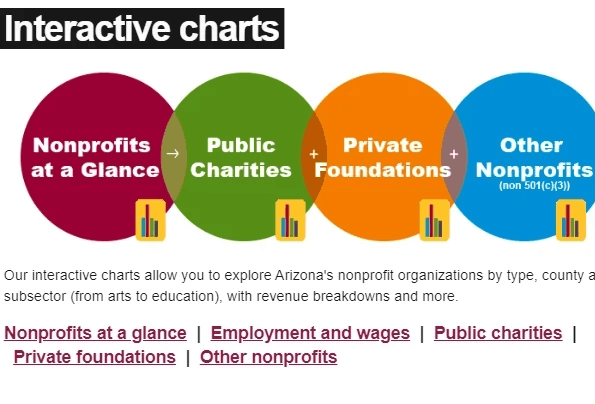
I led the development of a comprehensive knowledge resource and visualization platform to manage data from nonprofit organizations, conducted advanced analytics to uncover inefficiencies, and built data visualization tools to translate complex findings into actionable insights for decision-makers. It highlight the sector’s significant economic and social impact and provide comprehensive data management to optimize the sector’s operations.
Explore the interactive visualizations I built that have been kept to update ongoing new projects:
Methodologies
Methodologies
Methodologies
Data Governance and Security: Established a comprehensive data governance framework to ensure the integrity of data collected from over 100 nonprofit organizations.
Advanced Analytics Techniques: Applied multivariate regression analysis, clustering algorithms, and correlation analysis to evaluate the relationships between nonprofit funding and social impact.
Data Visualization for Social Impact: Developed interactive dashboards in Tableau and PowerBI to communicate key findings, enabling funders and nonprofit leaders to make data-driven decisions.
CRISM-DM Cycle for Tableau Dashboards: Applied the CRISM-DM cycle to handle the full data lifecycle—beginning with data understanding and business objectives, followed by data preparation, modeling, and deployment.
Impacts
Impacts
Impacts
Economic and Social Contributions: This project directly contributed to the sustainability of nonprofit organizations in Arizona and beyond. The insights enabled nonprofits to better allocate resources, preventing financial inefficiencies and poverty in vulnerable communities.
Tech for Social Good: By equipping nonprofit leaders with advanced data tools, the project helped enhance service provision, reduce operational costs, and maximize social impact.
Support for Underrepresented Groups: The insights generated from the Tableau dashboards enabled nonprofit leaders to advocate for better funding and support services, particularly for underrepresented groups.